Working with the Timeline
Learn how to use the timeline to explore log activity, focus on specific time ranges, and investigate events more efficiently.
The timeline provides a visual overview of your log data over time.

Instead of scrolling through thousands of log entries, you can quickly identify periods of high activity, focus on a specific incident, and inspect only the logs that matter.
The timeline stays synchronized with the log table, making it easy to move between visual trends and individual log entries.
Understanding the timeline#
The timeline groups log entries into time buckets and displays the number of log messages for each log level.
Each colored line represents a different log level, allowing you to see when errors, warnings, or informational messages occurred throughout the lifetime of the log.
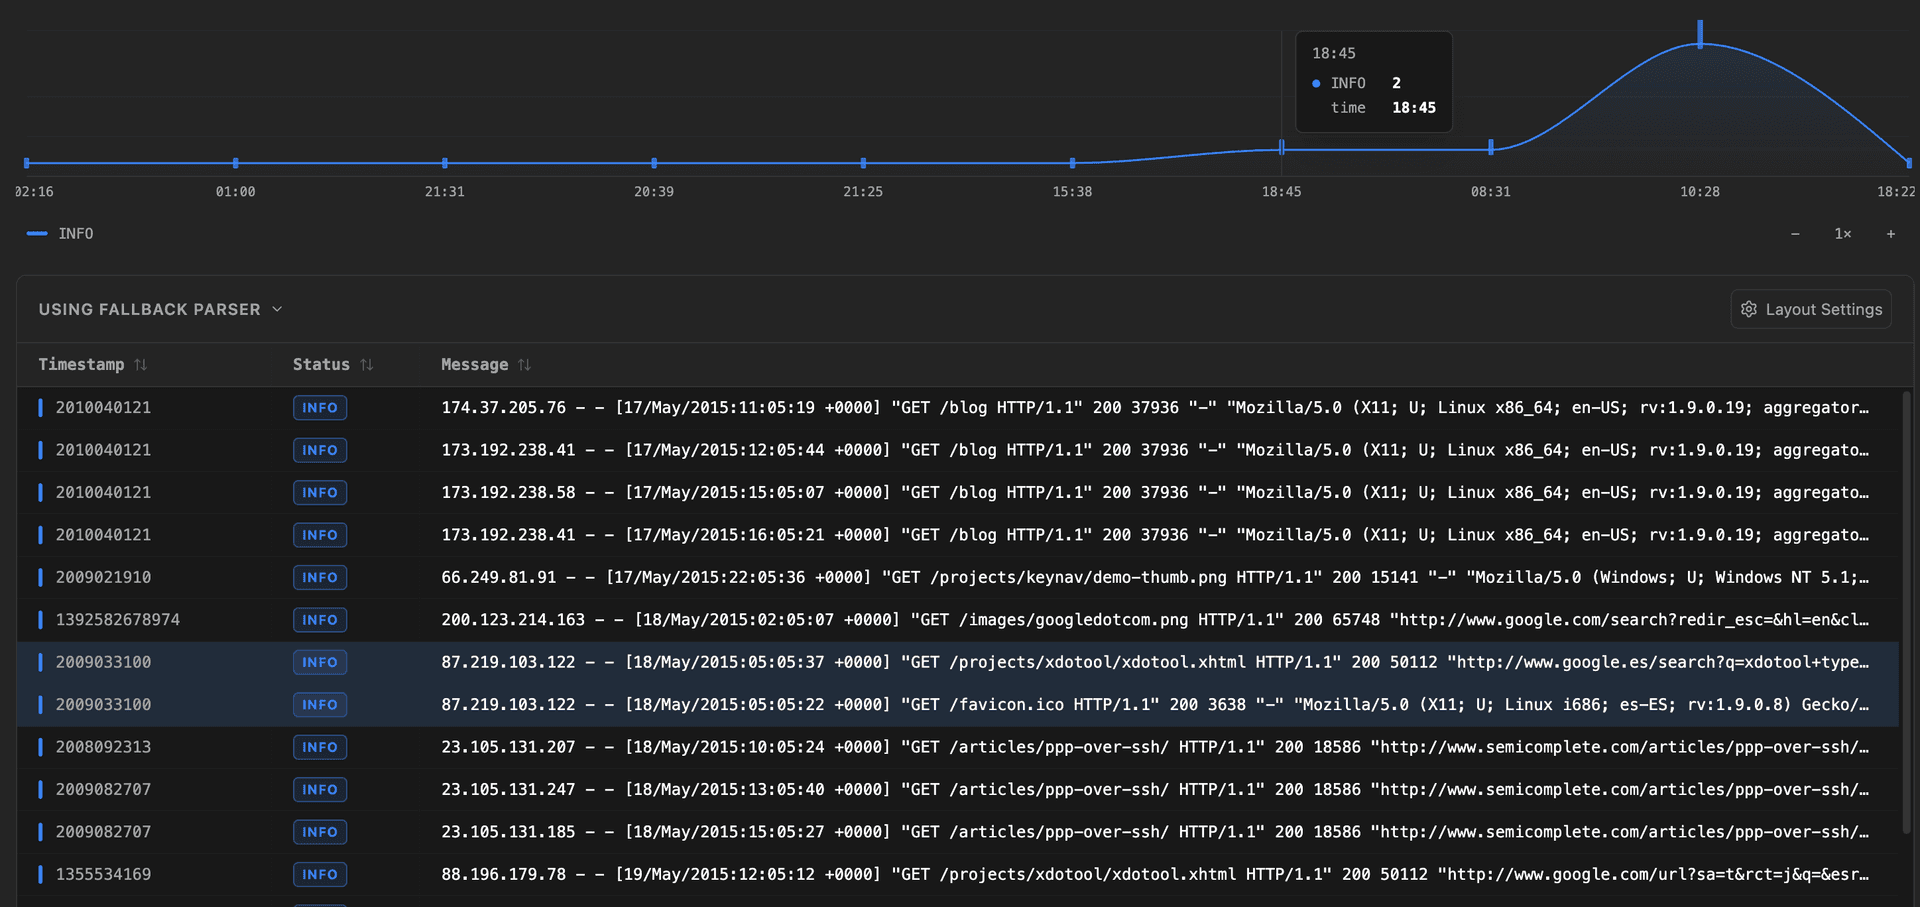
Use the legend below the chart to show or hide individual log levels. This makes it easier to focus on the events that are most relevant to your investigation.
Selecting a time range#
One of the fastest ways to investigate an issue is to select a portion of the timeline.
Click and drag across the chart to highlight a time range.
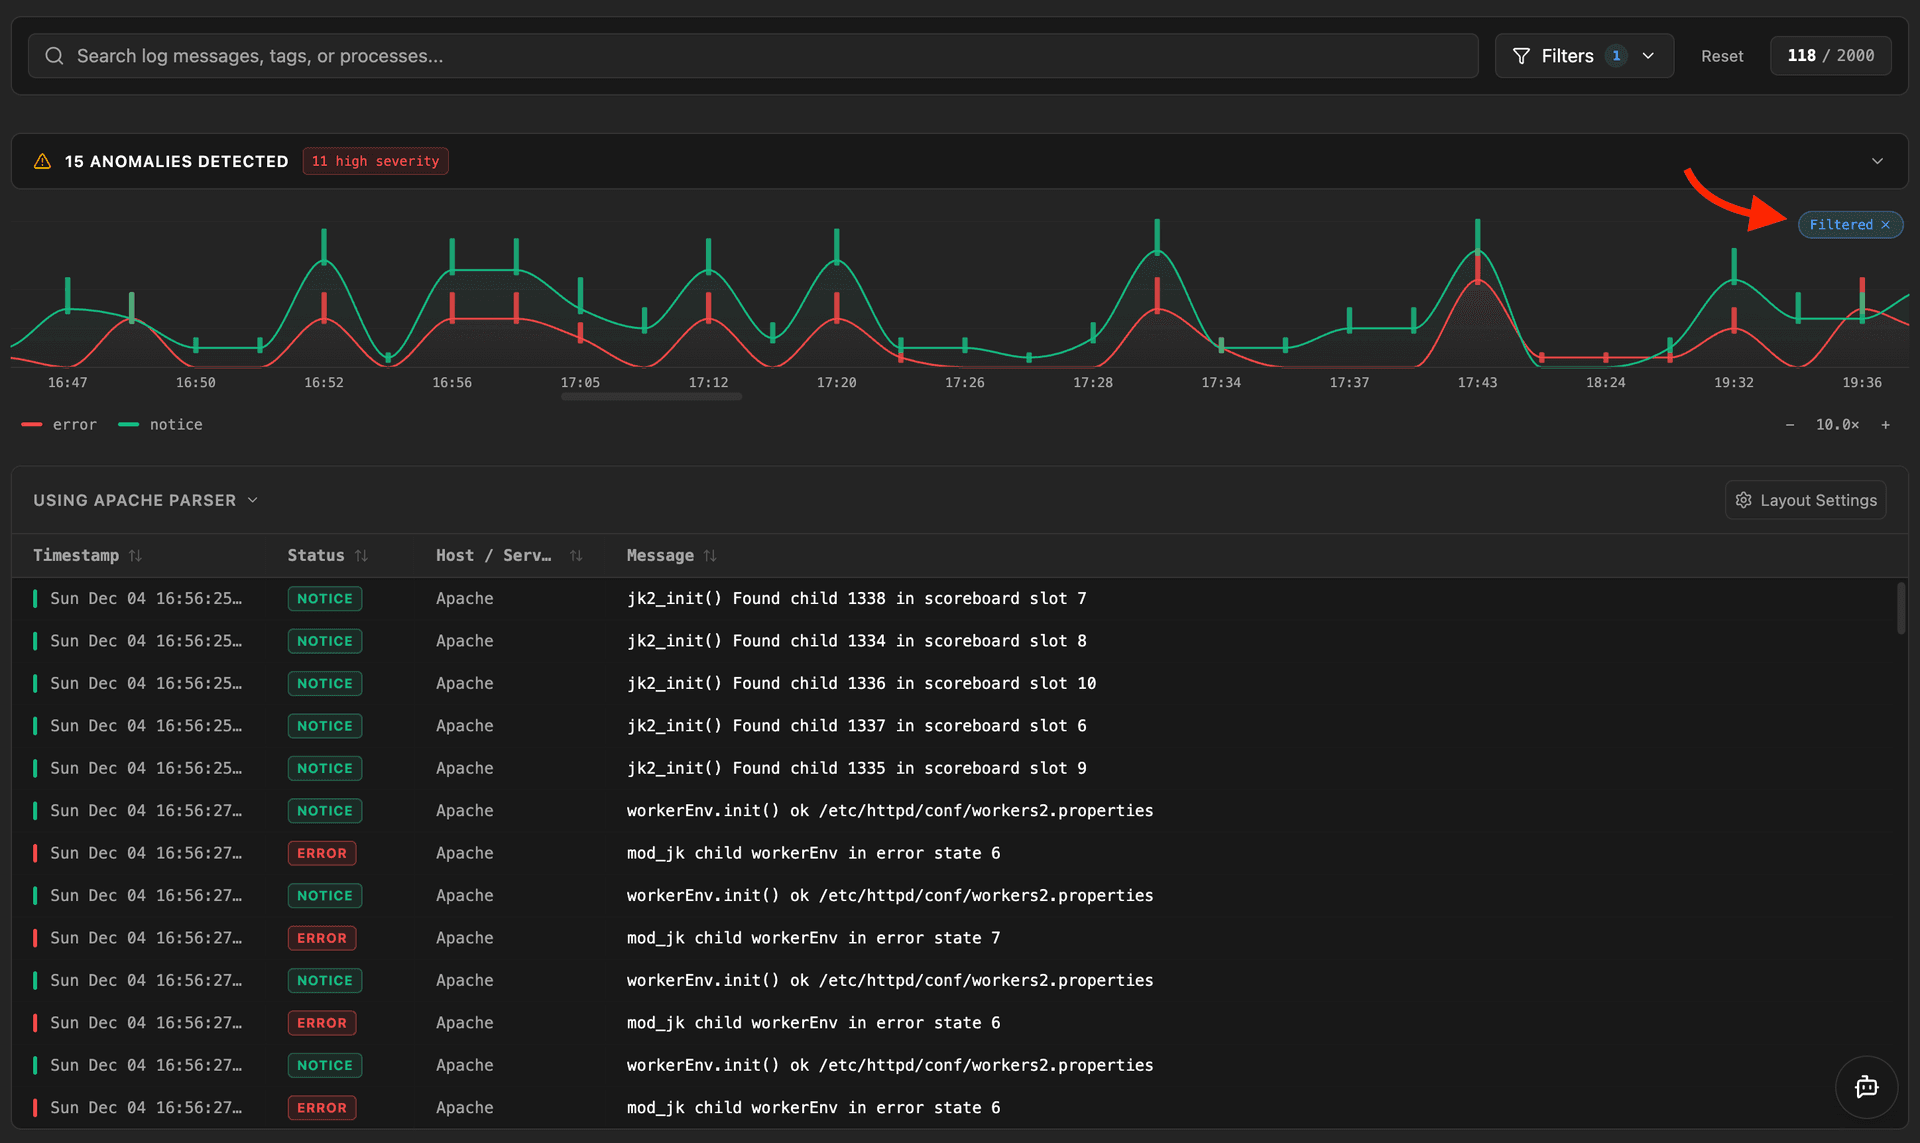
Once you release the mouse button:
- —The selected period becomes the active time filter.
- —The log table immediately updates to show only entries within that range.
- —The selected region remains highlighted so you always know which part of the timeline you're investigating.
A small Filtered indicator appears above the chart while a range filter is active. Select it to clear the filter and return to the full timeline.
The timeline always represents the complete log, even when a time filter is active. This allows you to create a new selection without first clearing the previous one.
Zooming into activity#
Large log files often contain hours or days of activity.
Use the zoom controls below the timeline to inspect busy periods in greater detail.
You can also hold Ctrl (⌘ on macOS) while scrolling the mouse wheel to zoom toward the cursor.
As you zoom, Logier keeps the point beneath your cursor in the same position, making it easy to inspect dense sections of the timeline without losing context.
When you select a time range, Logier automatically zooms and centers the chart around that selection so you can continue exploring nearby activity.
Use the reset zoom button to return to the full timeline.

Correlating the timeline with log entries#
The timeline and log table work together.
Move your mouse across the timeline to highlight the corresponding time window inside the log table.
As you move across the chart, matching log entries are highlighted immediately, allowing you to connect spikes in activity with the exact log messages that produced them.
This makes it much easier to investigate sudden bursts of errors or identify what happened immediately before and after an event.
Understanding paused live streams#
When viewing a live log stream, Logier marks periods where logging was paused.
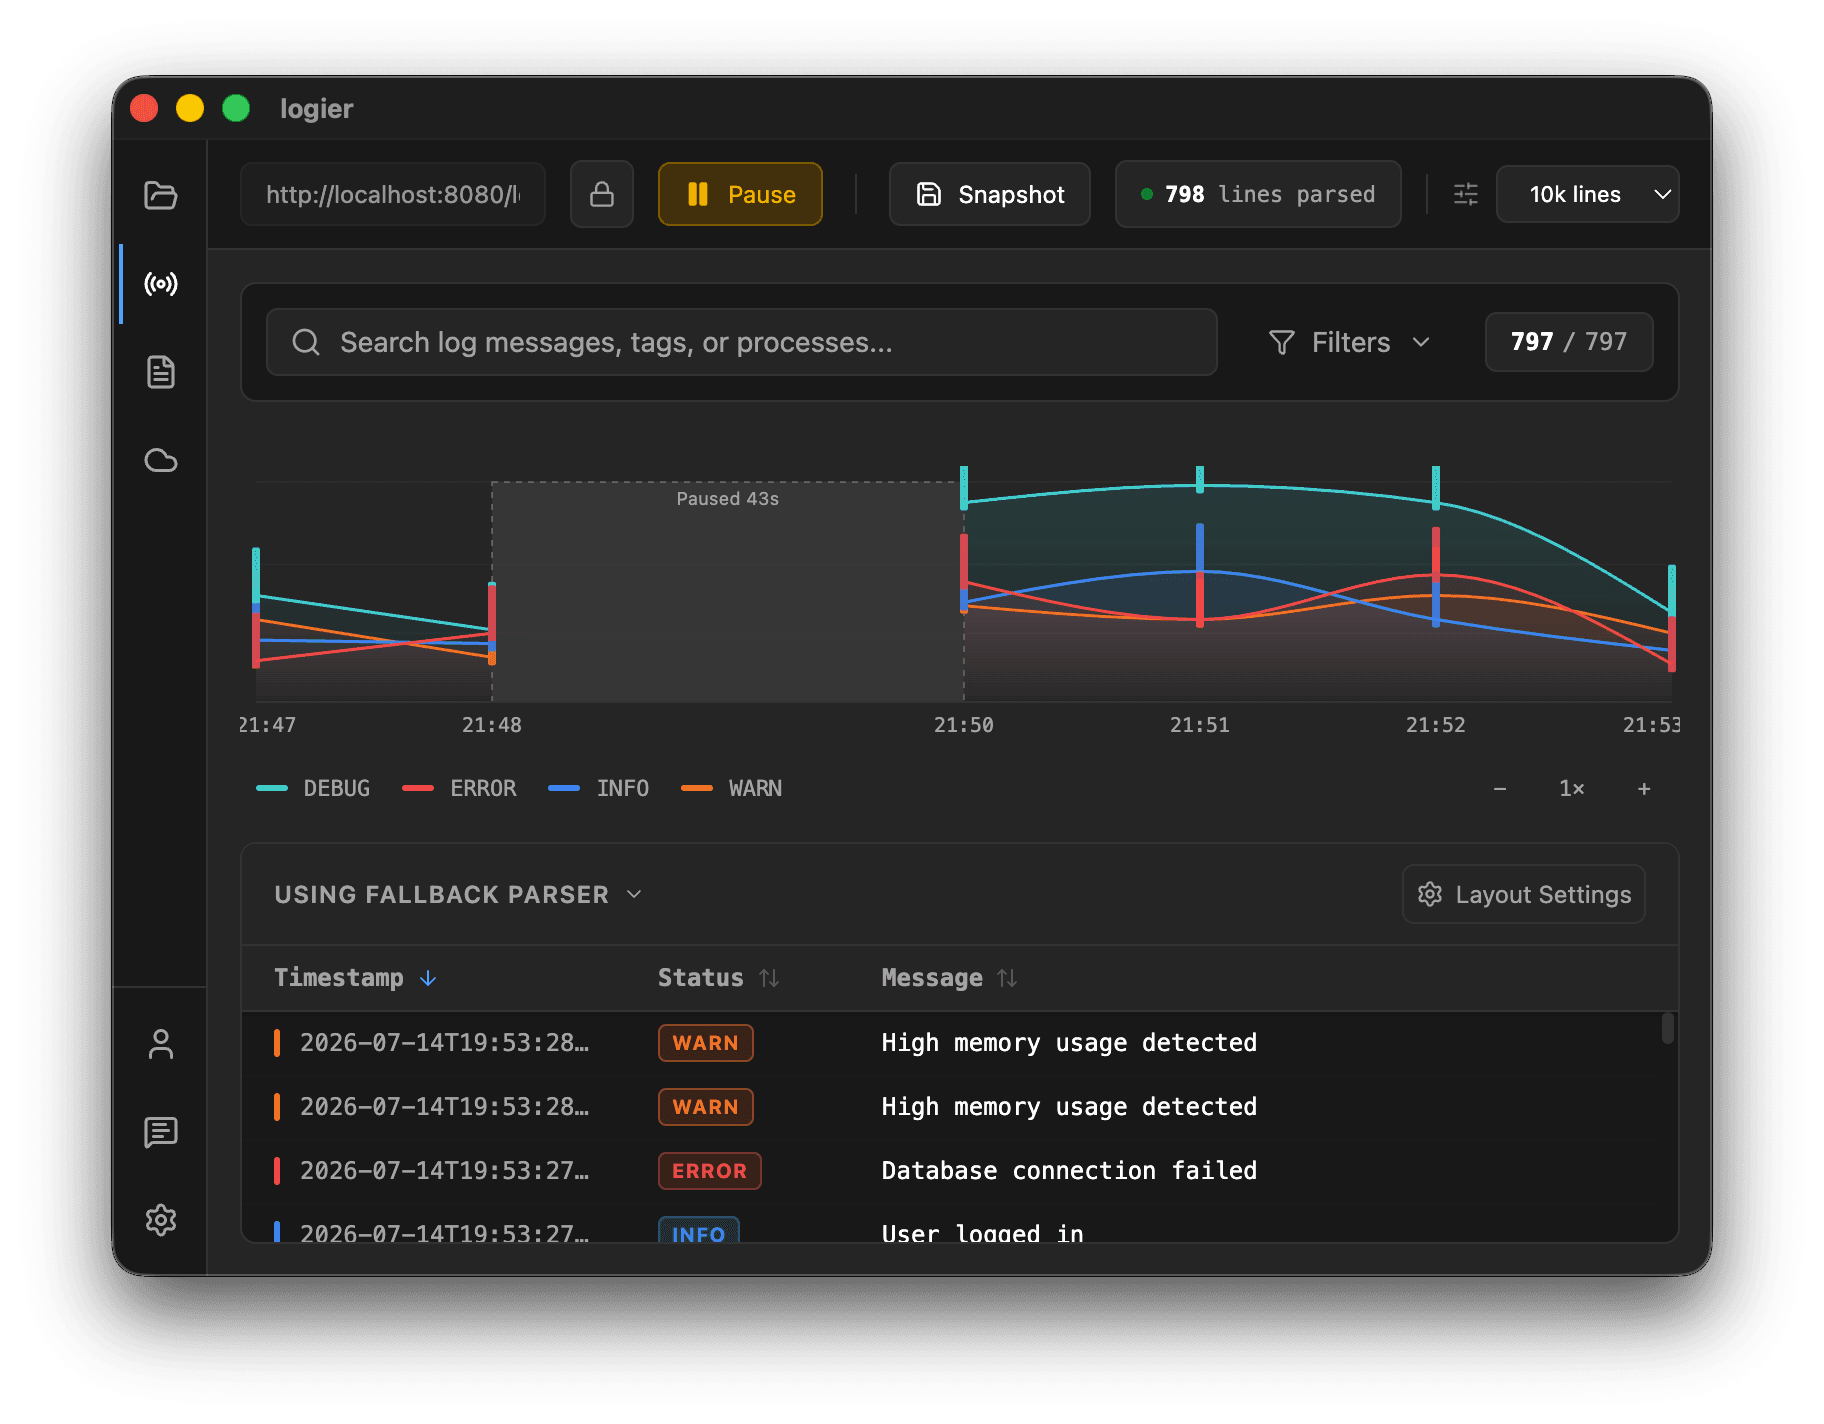
These intervals appear as shaded regions labeled with their duration.
Rather than connecting activity across missing data, Logier clearly shows where no logs were collected. This helps distinguish genuine quiet periods from gaps caused by pausing the live session.