Working with the Log Table
Learn how to use the log table to browse, sort, customize, and inspect log entries efficiently.
The log table is where you inspect individual log entries after narrowing down your investigation.
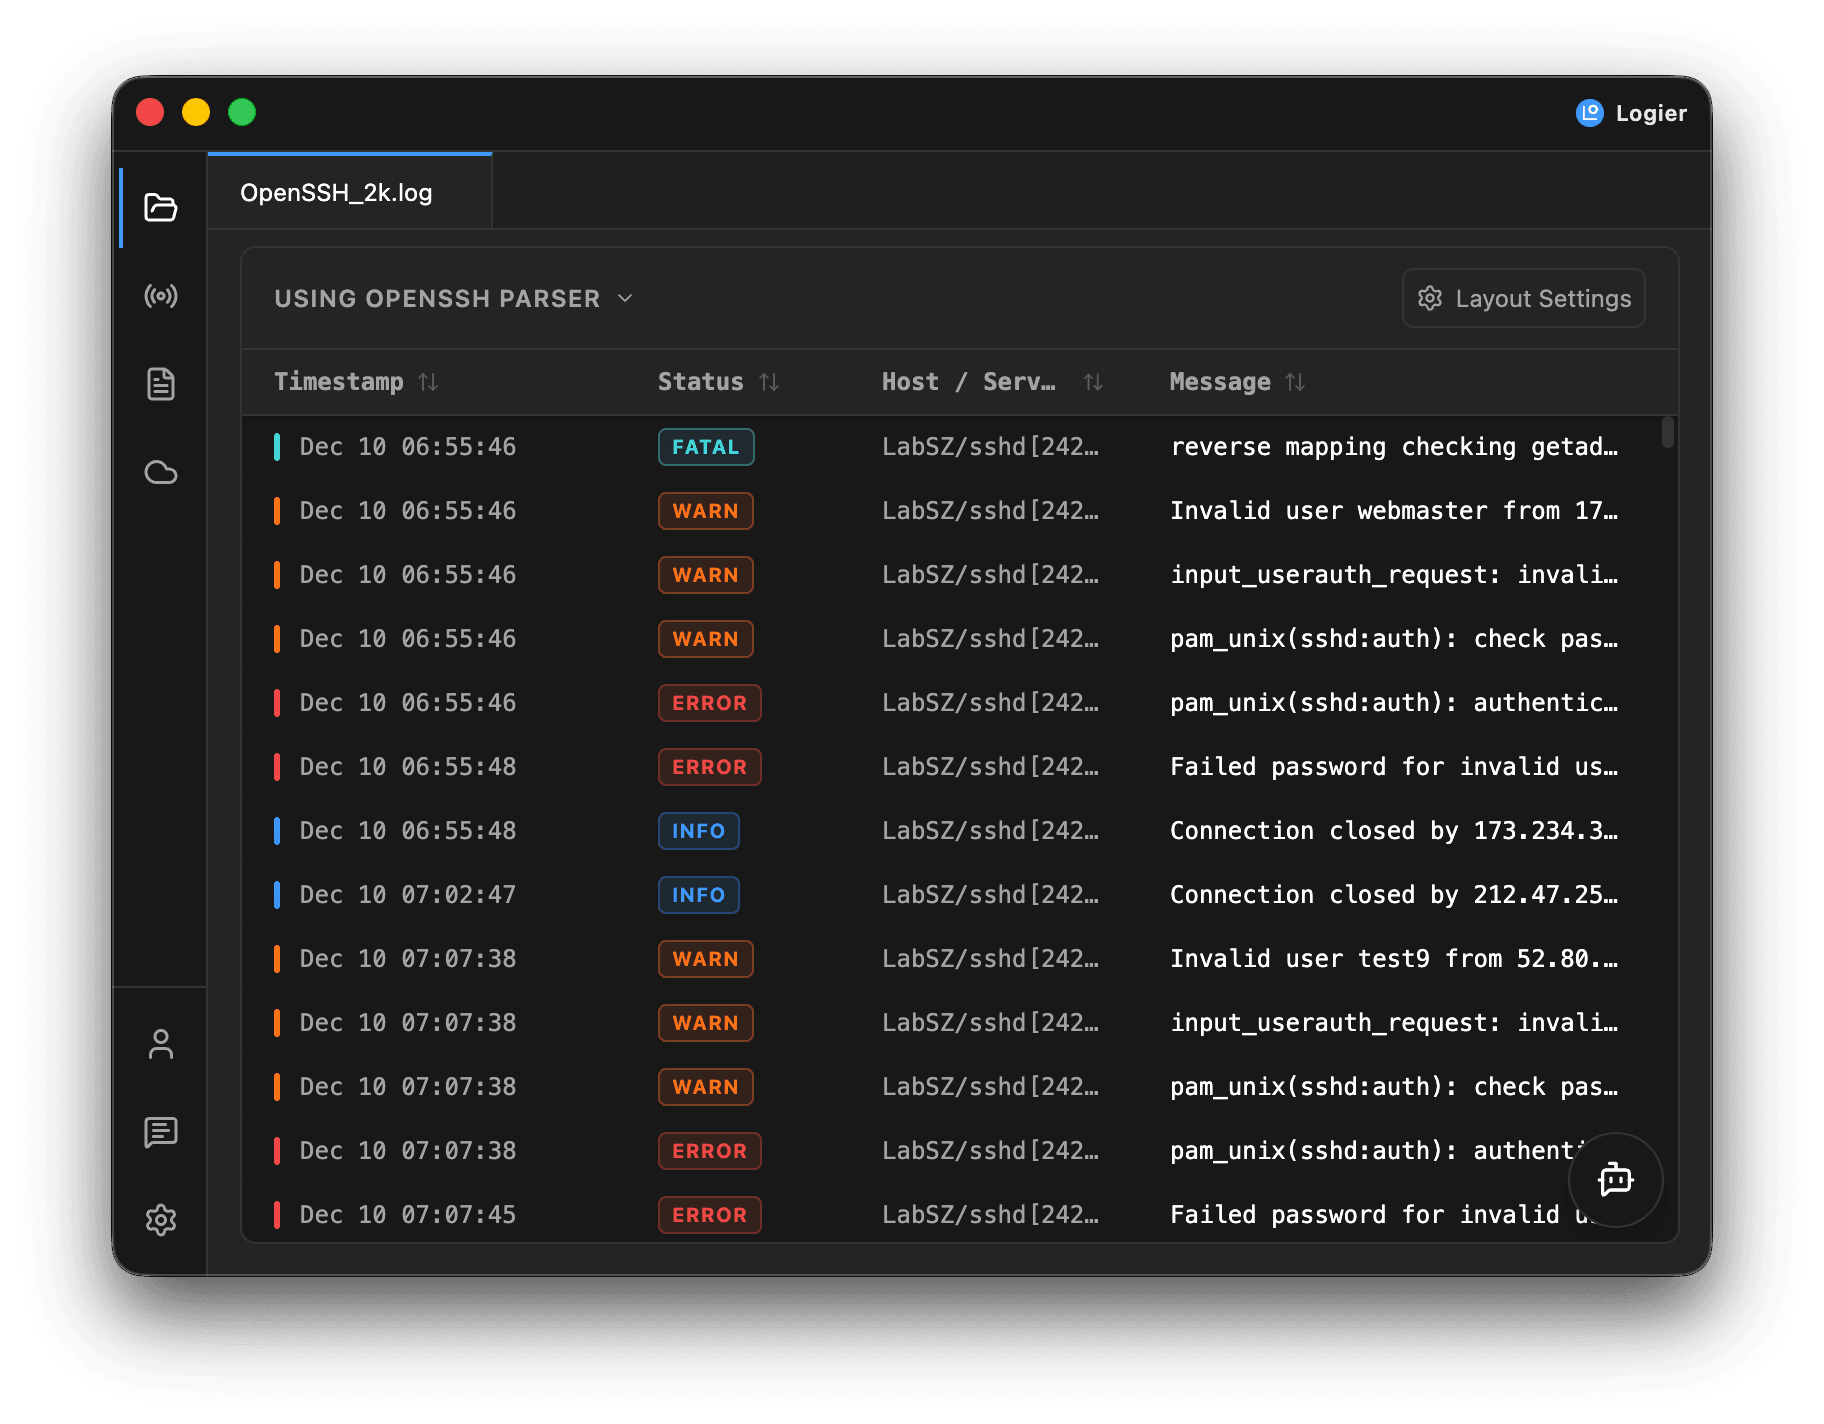
While the timeline provides an overview of activity, the table displays every matching log entry with its timestamp, level, service, and message. The table updates automatically as you apply filters, search, or select a time range.
Even when working with millions of log entries, Logier keeps scrolling and navigation responsive by rendering only the rows currently visible on screen.
Understanding the table#
Each row represents a single log entry.
Depending on the detected log format, the table may include columns such as:
- —Time
- —Level
- —Service
- —Message
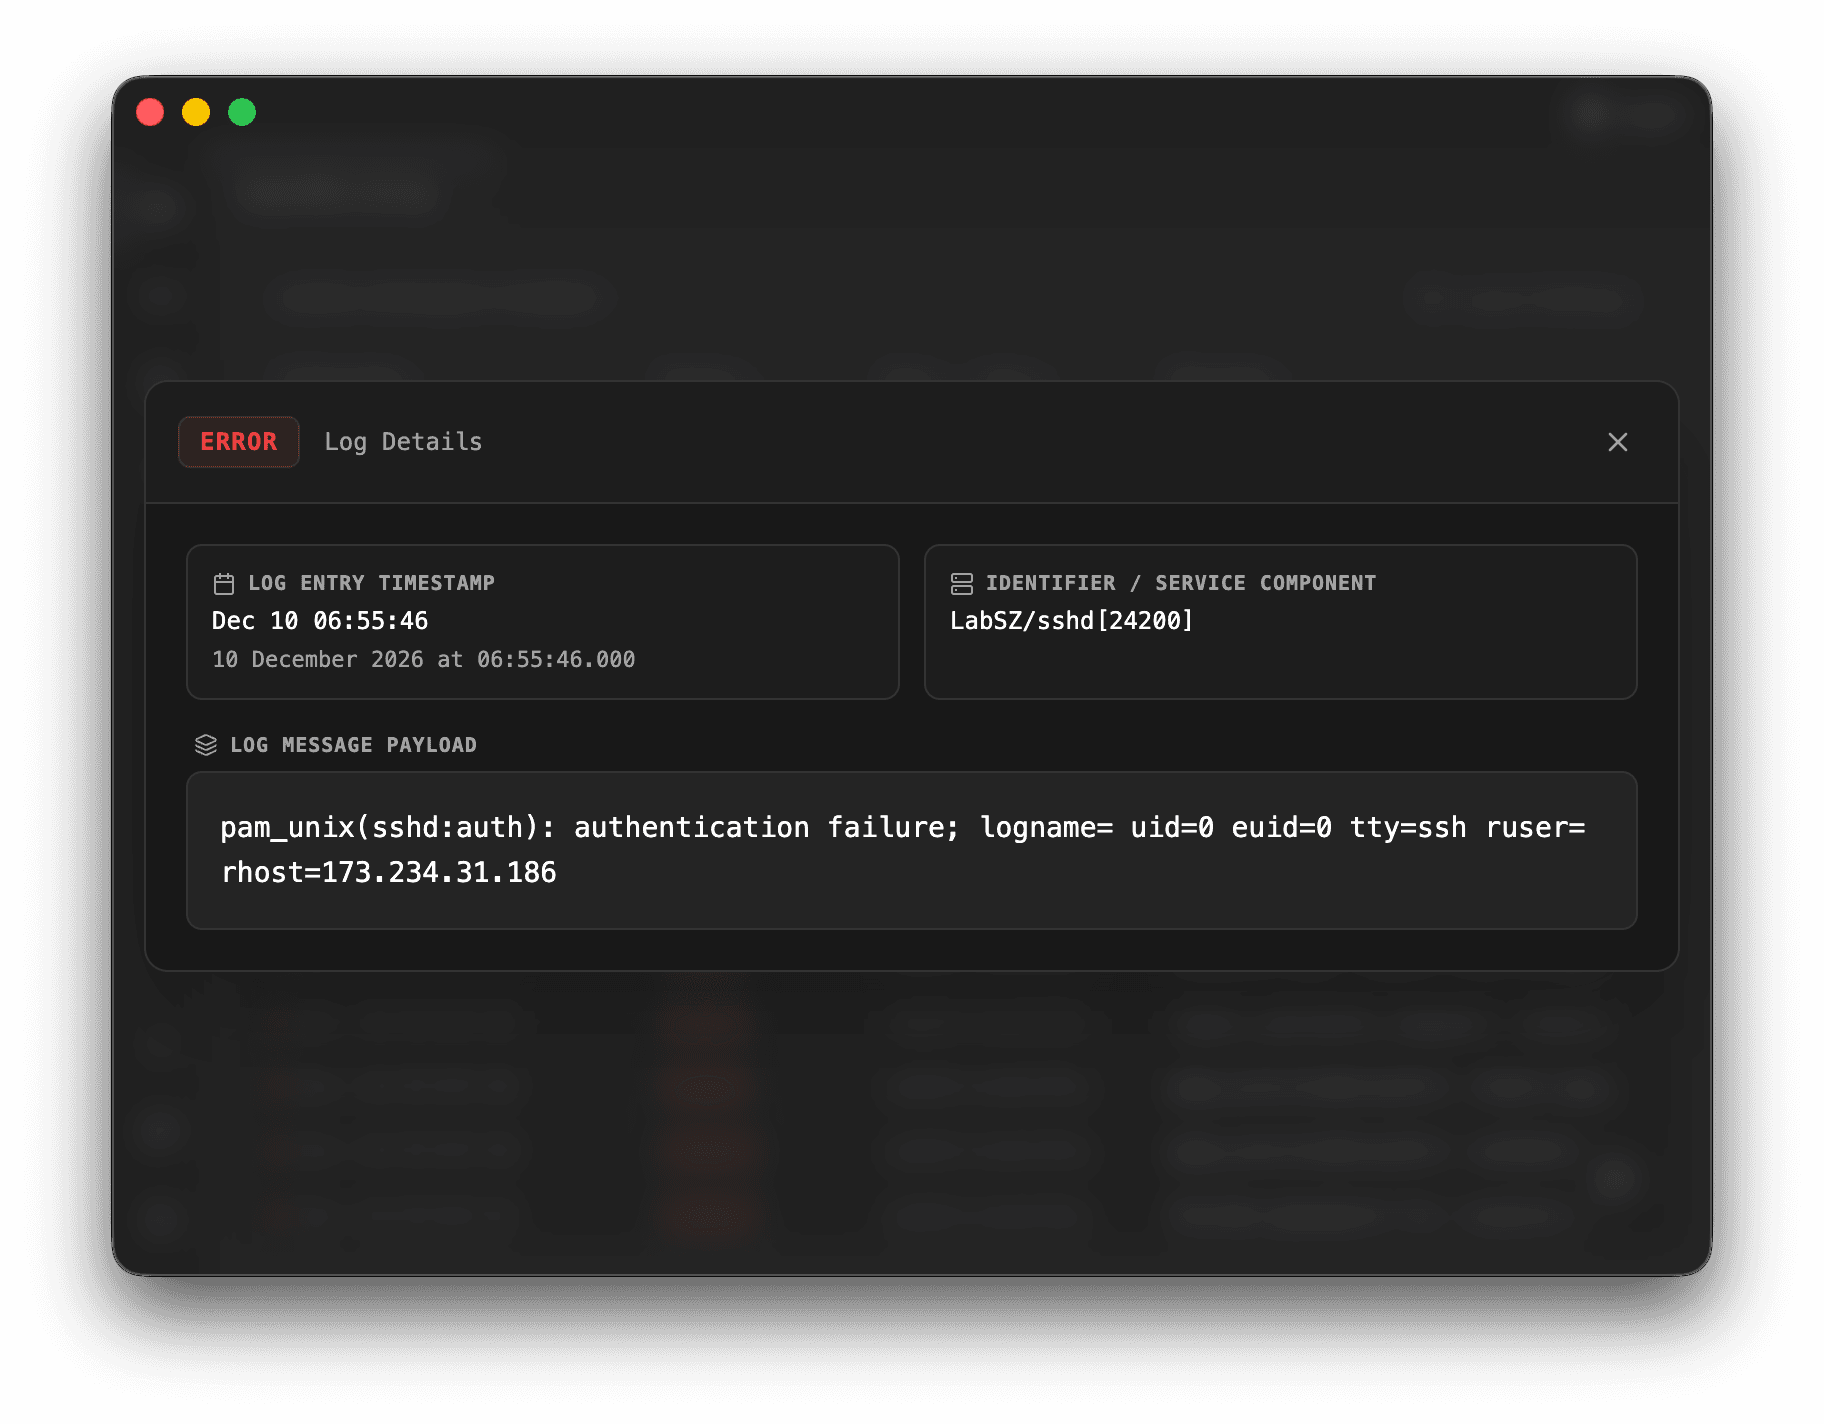
Click any row to open the full log details.
Sorting log entries#
Select any column header to sort the table.
Selecting the same column again reverses the sort direction.
For example, you can sort by:
- —Time
- —Log level
- —Service
- —Message
Sorting only changes how the current results are displayed. It does not modify your log file.
Customizing columns#
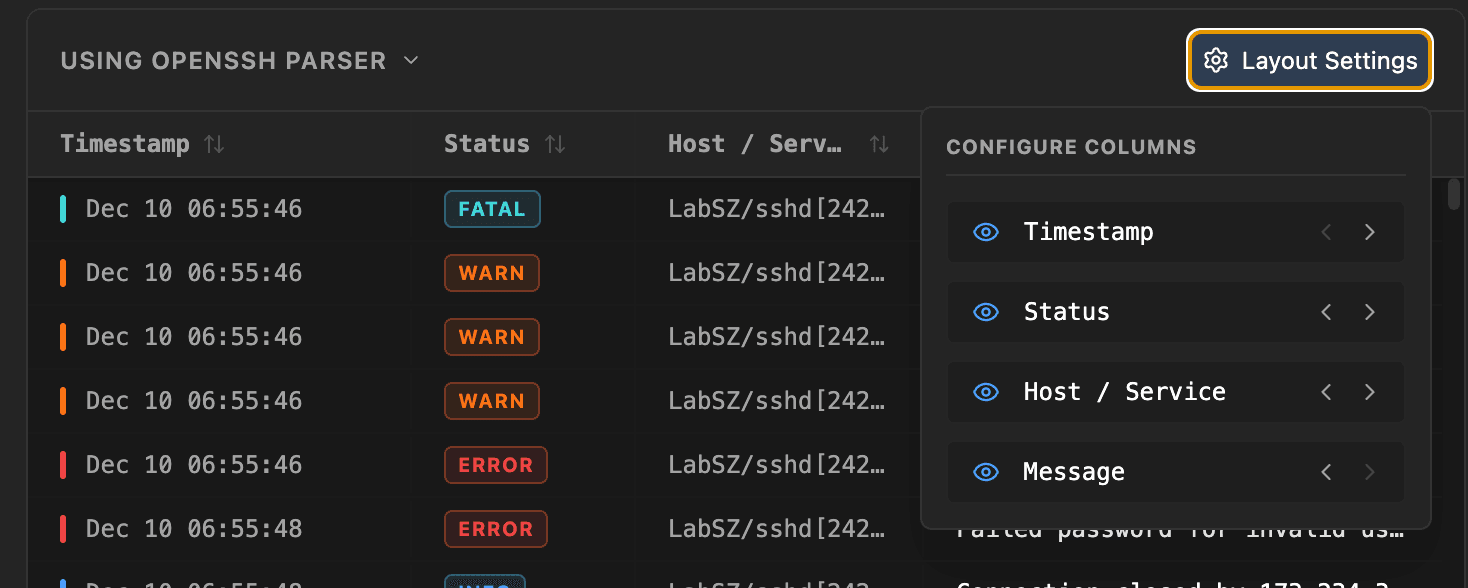
You can configure which columns are visible and how they are arranged.
Open the column settings menu above the table to:
- —Show or hide columns
- —Change the column order
You can also drag column borders to resize them.
These settings help you focus on the information that matters for your workflow.
Working with different log formats#
Not every log file uses the same format.
The parser selector above the table lets you switch between available parsers or choose automatic detection.
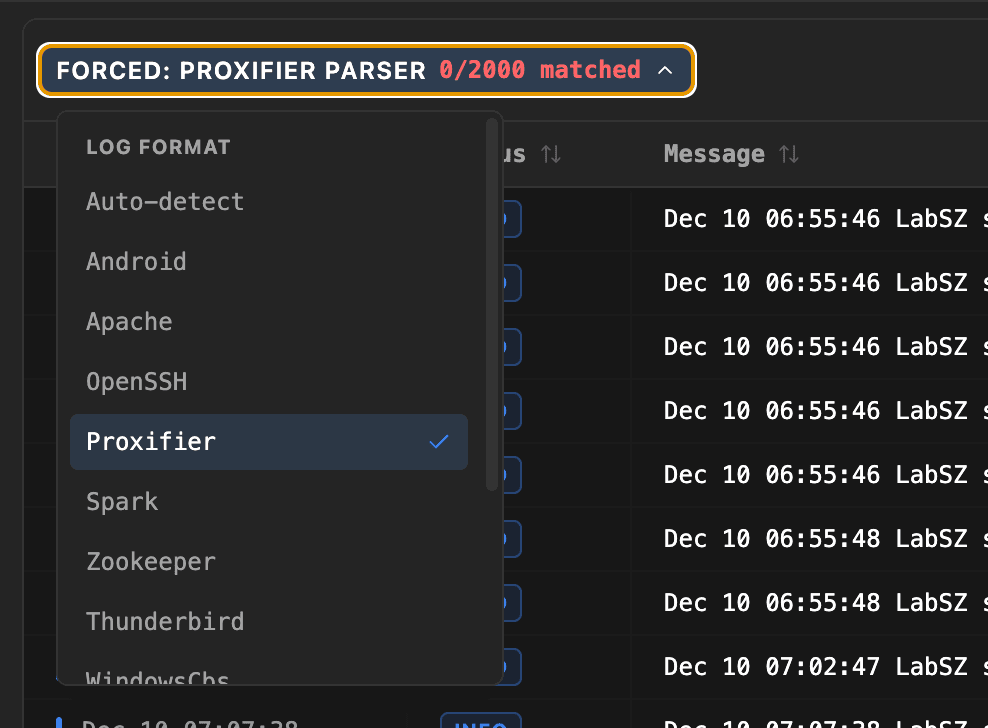
If none of the built-in parsers fit, you can teach Logier the format yourself. See Custom Log Formats.
When a different parser is selected, Logier reparses the log and updates the table using the new structure.
This makes it possible to inspect logs from different applications without manually reformatting them.
Using the table with filters#
The log table always reflects the currently active filters.
Results update immediately when you:
- —Search for text
- —Hide or show log levels
- —Filter by service
- —Select a time range from the timeline
If no entries match the current filters, the table displays a message instead of empty rows.
Because every filter works together, you can quickly narrow thousands of log entries down to the handful that matter.
Correlating with the timeline#
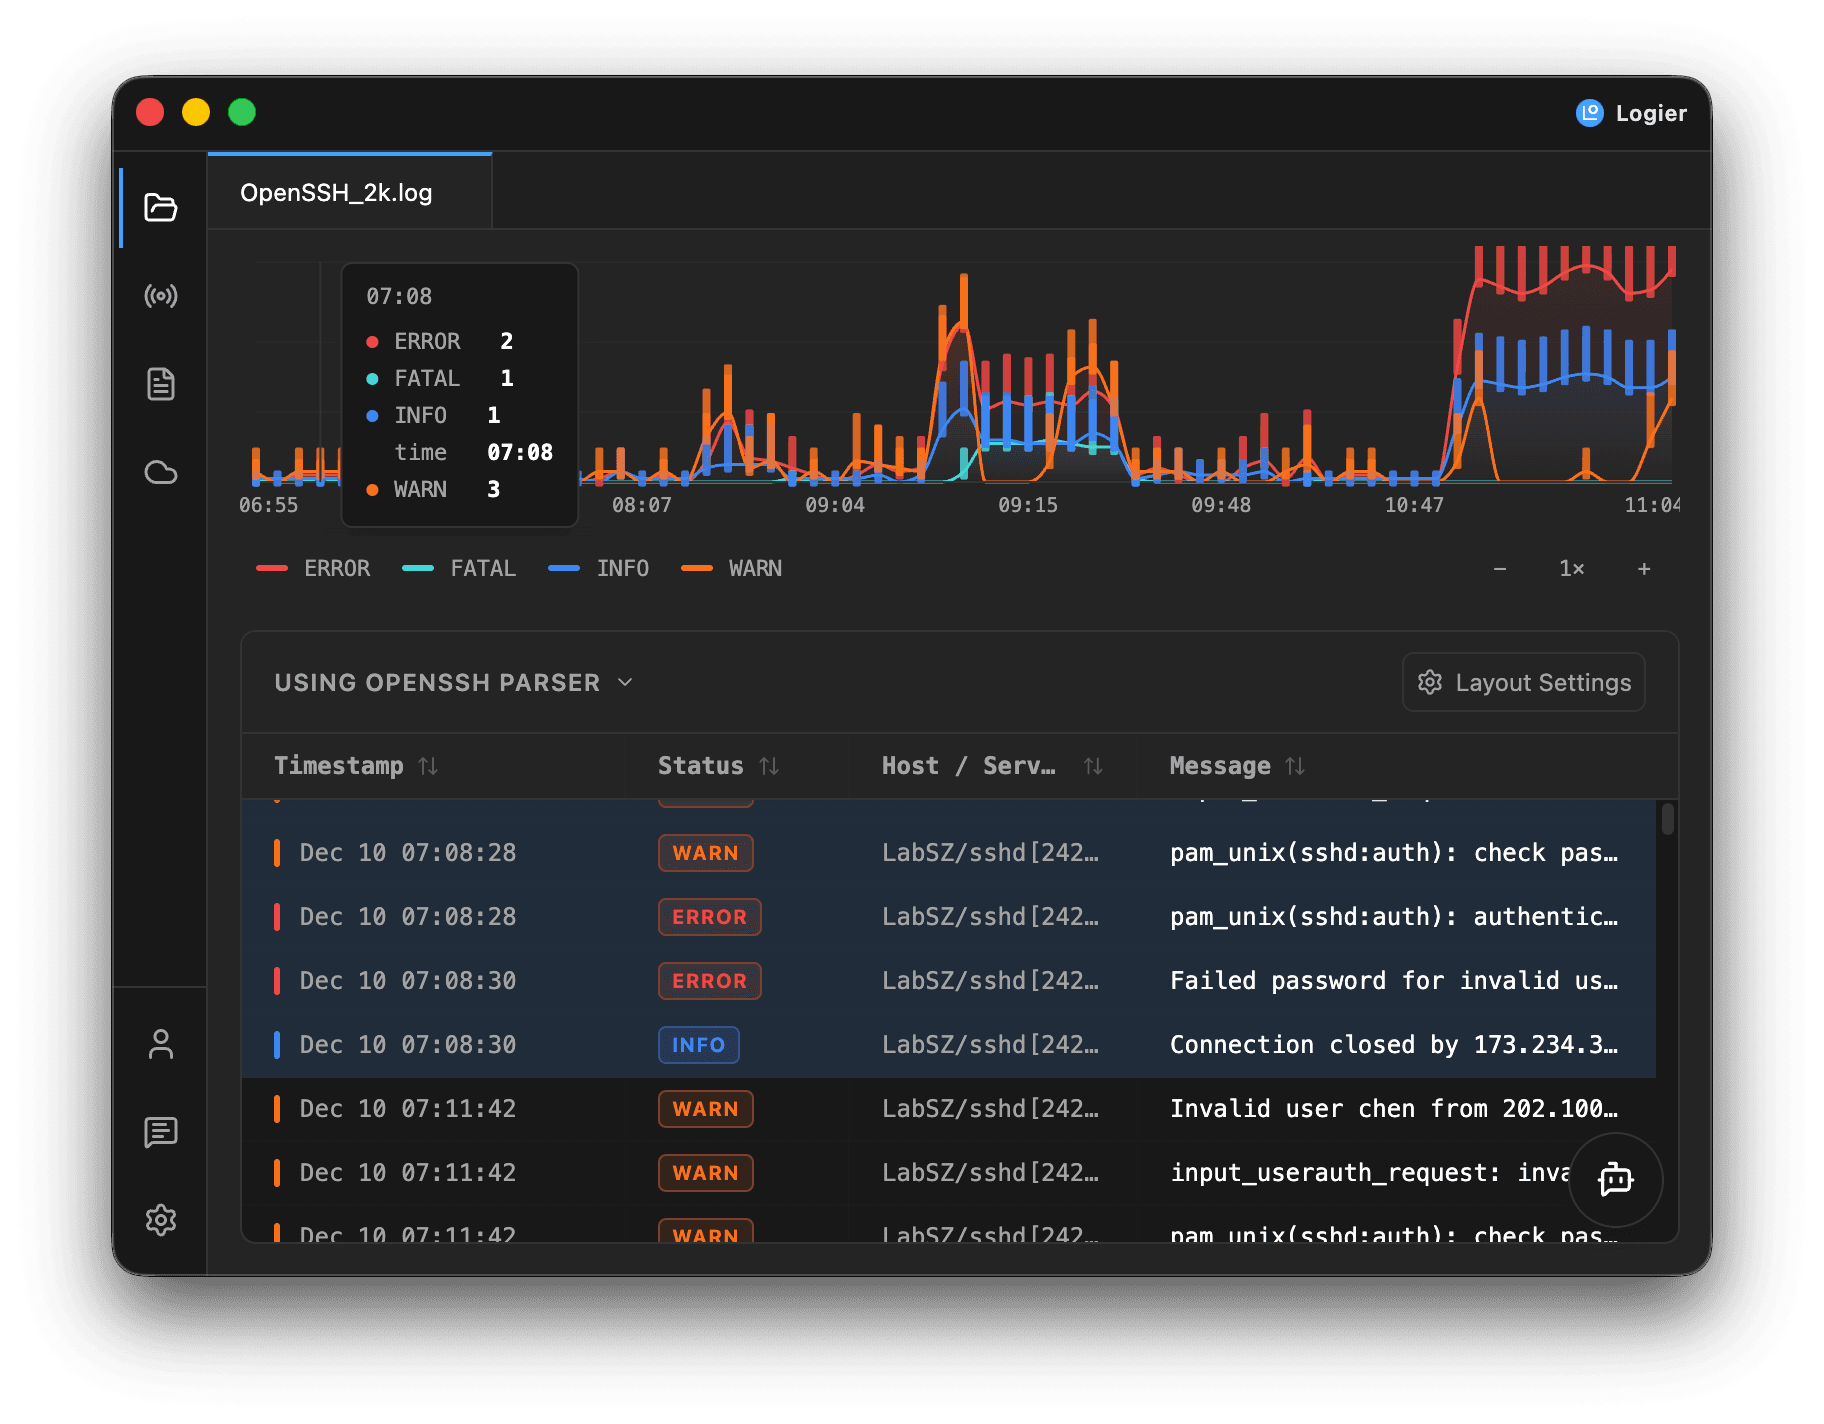
The table is synchronized with the timeline.
Move your mouse across the timeline to temporarily highlight log entries from the corresponding time window.
This makes it easy to connect spikes in activity with the exact log messages that occurred during that period.