Filtering Log Entries
Use the search bar's query language and the Filters panel to narrow large log files down to exactly the entries you're looking for.
The search bar sits above the log table whenever you have a file open. On the surface it's a plain search box, but it understands a small query language: you can scope a term to a field, exclude terms, match exact phrases, and drop in a regular expression.
Alongside it, the Filters panel gives you point-and-click controls for log levels, time ranges, and services. Search and filters work together, so you can combine a typed query with a couple of toggles to zero in fast.
Everything runs locally over the parsed file, so the log table, timeline, and other tools update as you type.
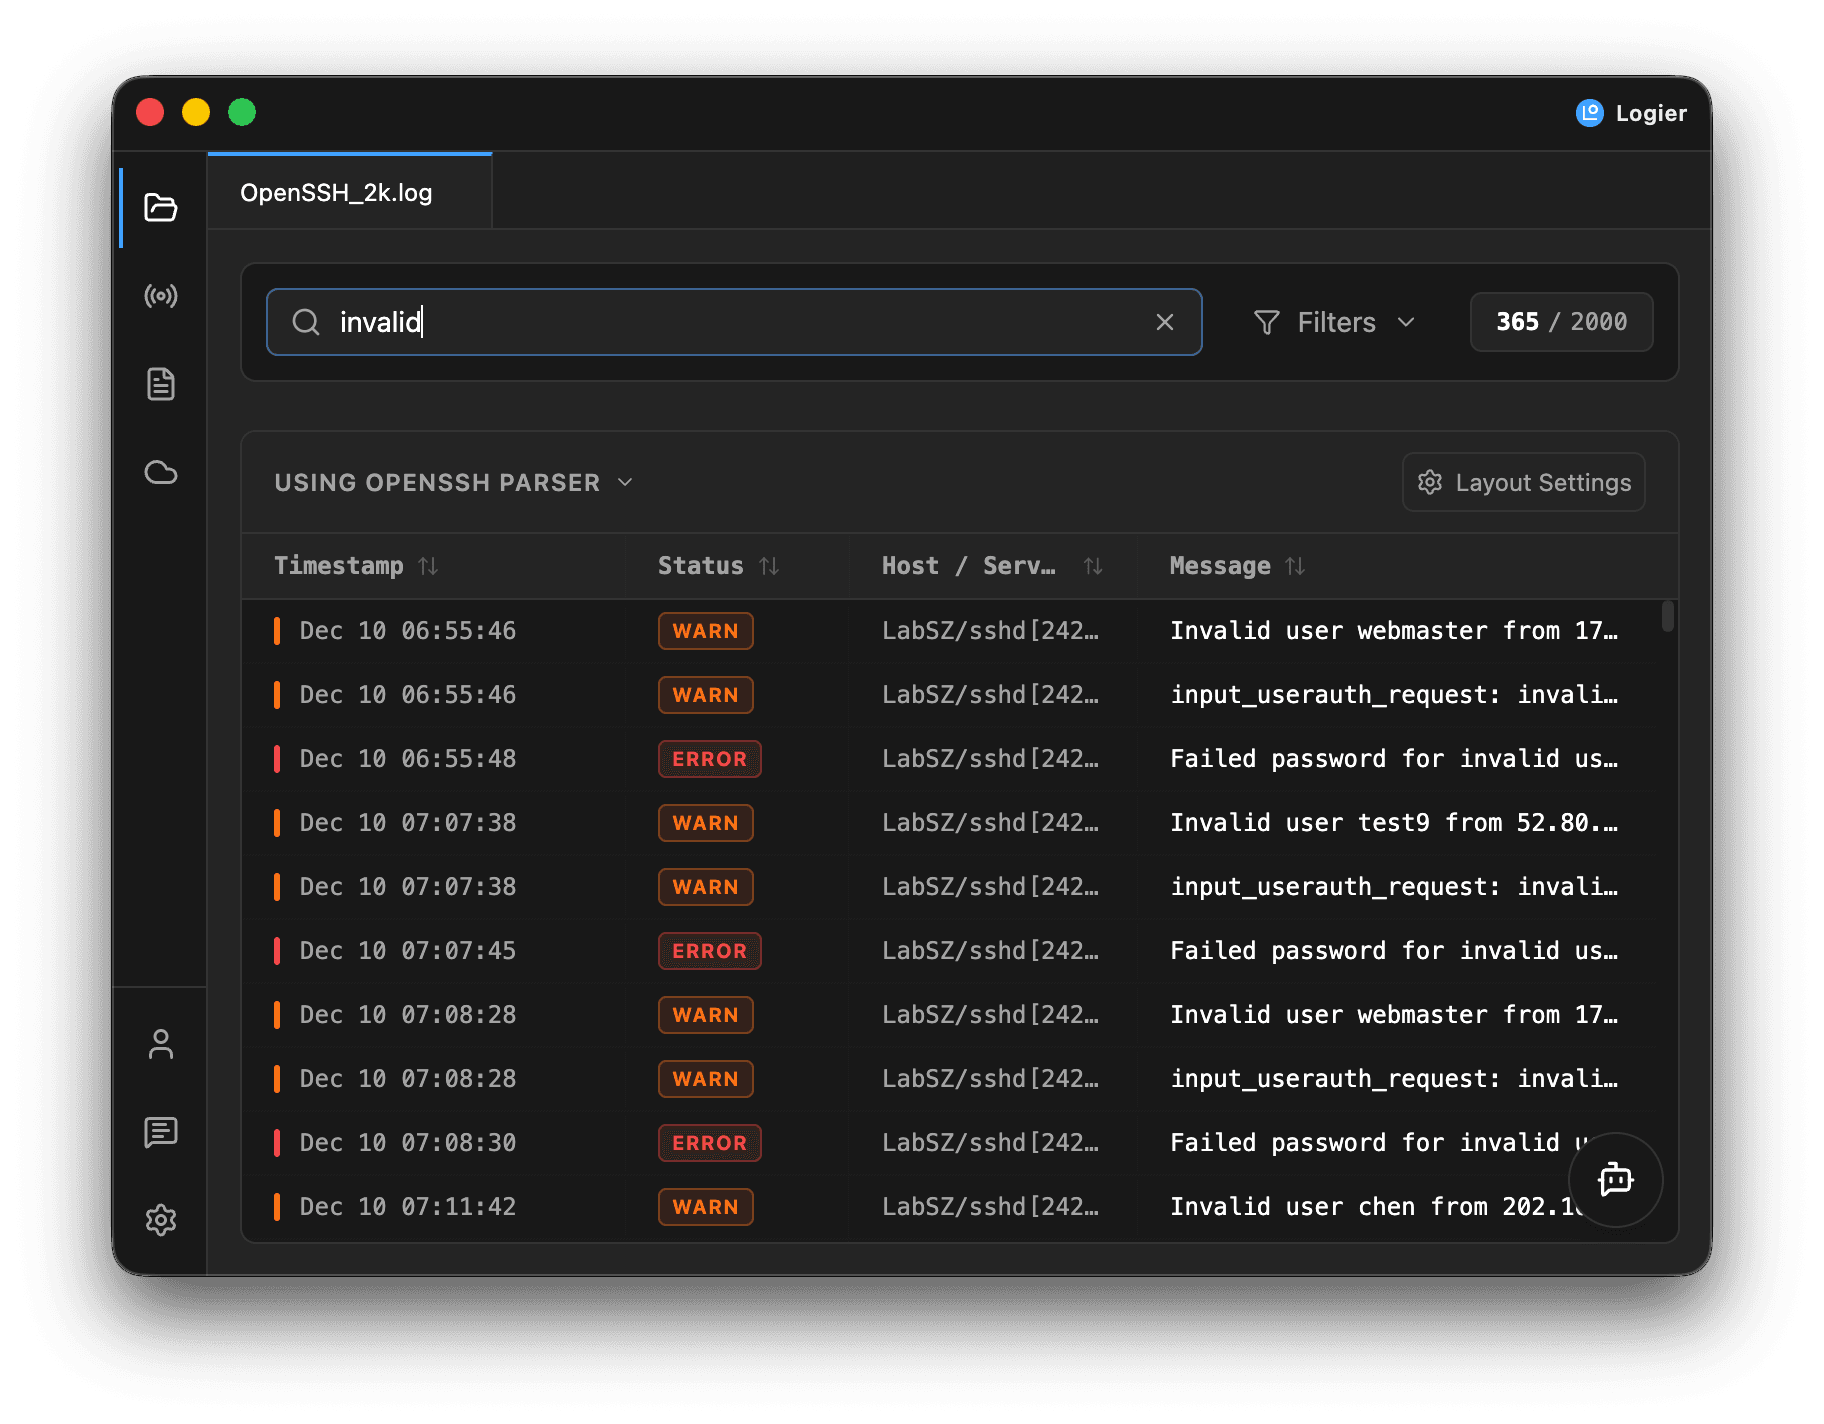
The search box#
Type into the box and Logier matches your text against the fields a reader actually sees: the message, service, level, and tag. The counter on the right shows how many entries match out of the total.
As you type, the query is color-coded so each part is easy to read, and an autocomplete list suggests fields and values.
Free text#
A plain word matches anywhere in those visible fields:
timeout
Multiple words are combined with AND by default, so an entry has to match all of them:
database timeout
Scoping to a field#
Prefix a term with a field name and a colon to search only that field:
level:error
service:api
Fields accept short aliases, so you can type whichever comes naturally:
- —
level— alsolvl,severity - —
service— alsosvc,host,component - —
message— alsomsg,text - —
tag - —
pid— process id - —
tid— thread id - —
time— alsots,timestamp - —
raw— the original, unparsed line
Excluding terms#
Put a - in front of a term to hide entries that match it:
-healthcheck
level:error -timeout
Exact phrases#
Wrap text in quotes to match it exactly, spaces included:
"connection refused"
Regular expressions#
Wrap a pattern in slashes to match with a regular expression. Flags are optional and matching is case-insensitive by default:
/user \d+ not found/
/failed/i
If a pattern is invalid, a small warning icon appears in the box and no regex filtering is applied until you fix it.
Combining with OR#
Terms are AND-ed together by default. Use an uppercase OR to match either side:
level:error OR level:warn
You can mix all of these in a single query:
service:api level:error -timeout "connection refused"
Autocomplete#
As you type, a dropdown suggests fields and known values, drawn from the levels and services actually present in your file.
- —
↑/↓— move through suggestions - —
EnterorTab— accept the highlighted suggestion - —
Esc— dismiss the list
Picking a field keeps the list open so you can choose a value next.
The Filters panel#
Click Filters to open the panel. It gives you three sets of controls:
- —Levels — every log level discovered in the file. Click one to hide it; click again to show it.
- —Time range — limit the view to a recent preset window, or to a custom range you've selected on the timeline.
- —Services — search and check the services (or components) you want to keep.
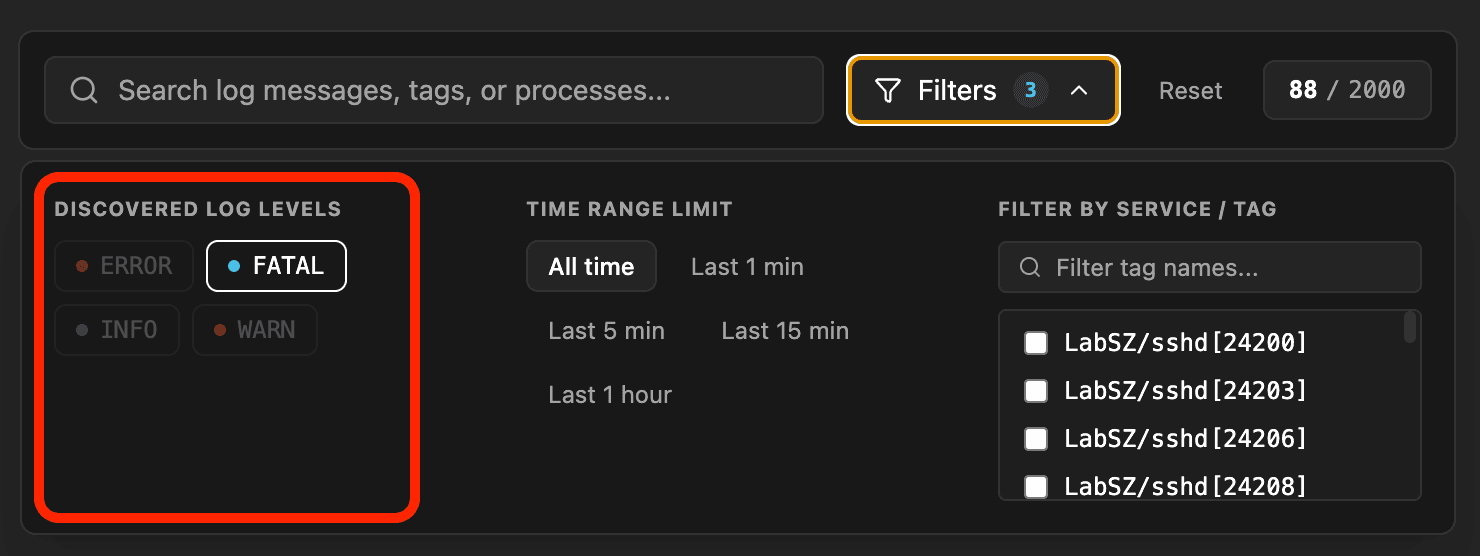
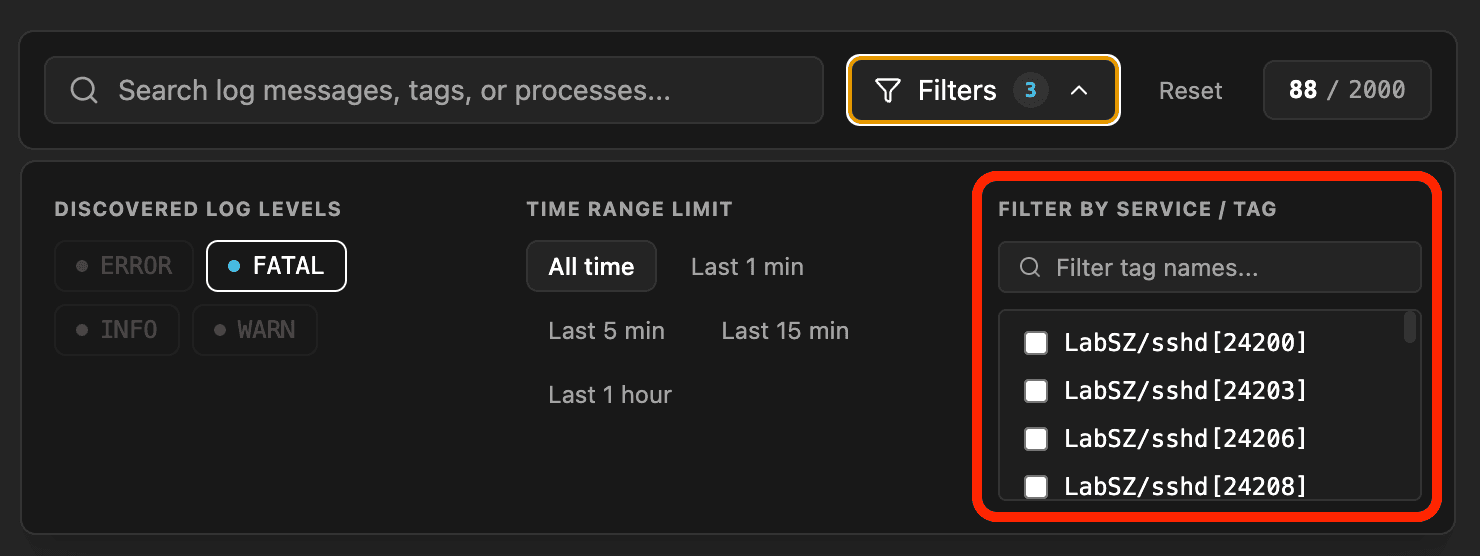
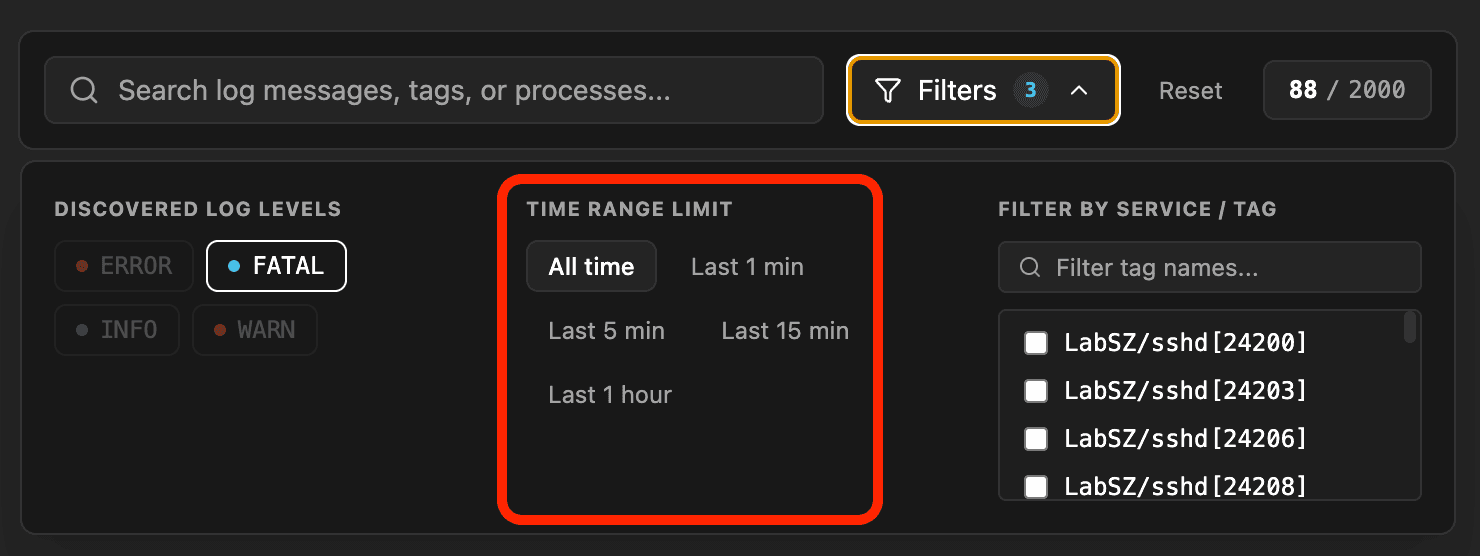
Log levels and services are discovered from the file itself, so the lists adapt to each log instead of using a fixed set. When you select a custom range on the timeline, the relative time presets are disabled, because only one time filter can be active at a time.
Counters and resetting#
A badge on the Filters button shows how many filters are active — hidden levels, selected services, and a time range. The search query is tracked separately, so text search doesn't change the filter badge.
The result counter next to it always shows how many entries survive your current filters out of the file's total:
124 / 8,731
When any filter is active, a Reset control appears. It clears everything at once — level toggles, the time range, selected services, and the search box — restoring the complete log. It's the fastest way back to the full dataset before a new investigation.
Why search and filters share state#
The search box and the Filters panel write to the same underlying filter state as Logier's Copilot. When you ask Copilot to "show only errors" or "filter for timeouts," it drives these exact controls, so the table, timeline, and filter badge update just as if you'd typed the query yourself. There's only ever one source of truth for what's visible.
Best Practices#
- —Start broad with free text, then scope to a field once you know where the signal is.
- —Use
-to strip out noisy, expected lines (health checks, heartbeats) rather than scrolling past them. - —Reach for a phrase (
"...") before a regex — it's faster to type and usually enough. - —Combine a typed query with the level toggles to cut a large file down in two moves.
Troubleshooting#
My regex isn't matching
Check for the warning icon in the search box — an invalid pattern is ignored until it's fixed. Remember matching is case-insensitive unless you add flags.
Nothing matches after filtering
You may have several filters stacked. Check the count badge on the Filters button and use Reset to clear everything, then reapply one filter at a time.