Understanding Anomalies
Learn how Logier automatically detects unusual patterns in your logs and helps you jump directly to the events that deserve attention.
Large log files often contain thousands or even millions of entries, making it difficult to know where to begin.
The Anomalies panel automatically analyzes your logs and highlights unusual behavior, such as sudden error spikes, unexpected messages, long periods of silence, or unusually slow operations. Instead of manually searching through the entire log, you can immediately focus on events that are likely to be important.
Anomalies are intended as investigation starting points. They use statistical heuristics to identify unusual patterns, not guaranteed problems.
Opening the Anomalies panel#
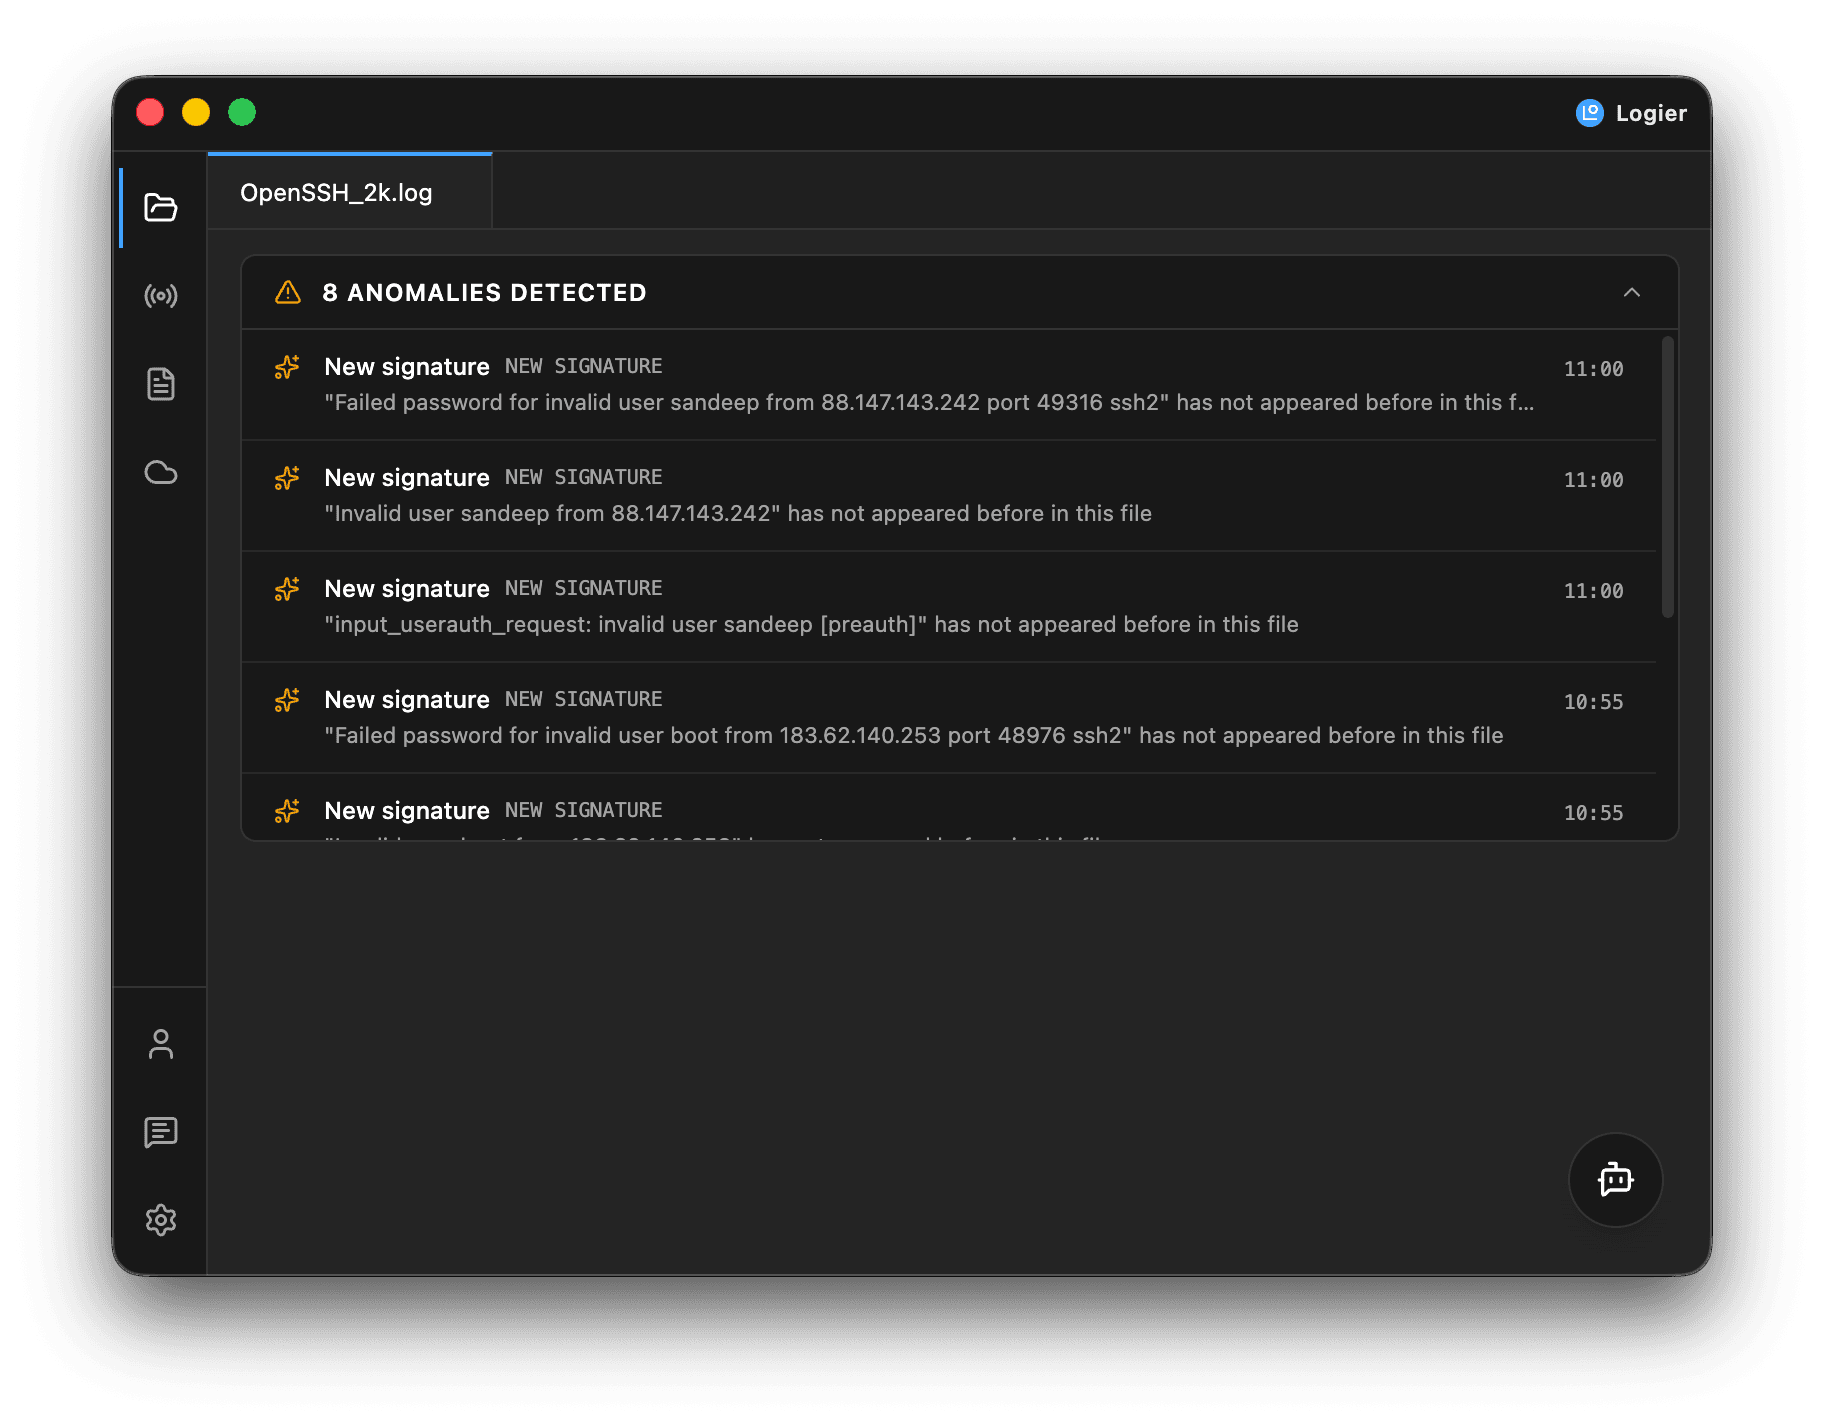
When Logier detects unusual behavior, an Anomalies panel appears above the log table.
The panel displays:
- —The total number of detected anomalies.
- —The number of high-severity findings.
- —A collapsible list of all detected anomalies.
Select the panel header to expand or collapse the results.
Inspecting an anomaly#
Each anomaly includes:
- —A descriptive title
- —A short explanation
- —The anomaly type
- —Its severity
- —The time it occurred
Select any anomaly to jump directly to the corresponding log entry.
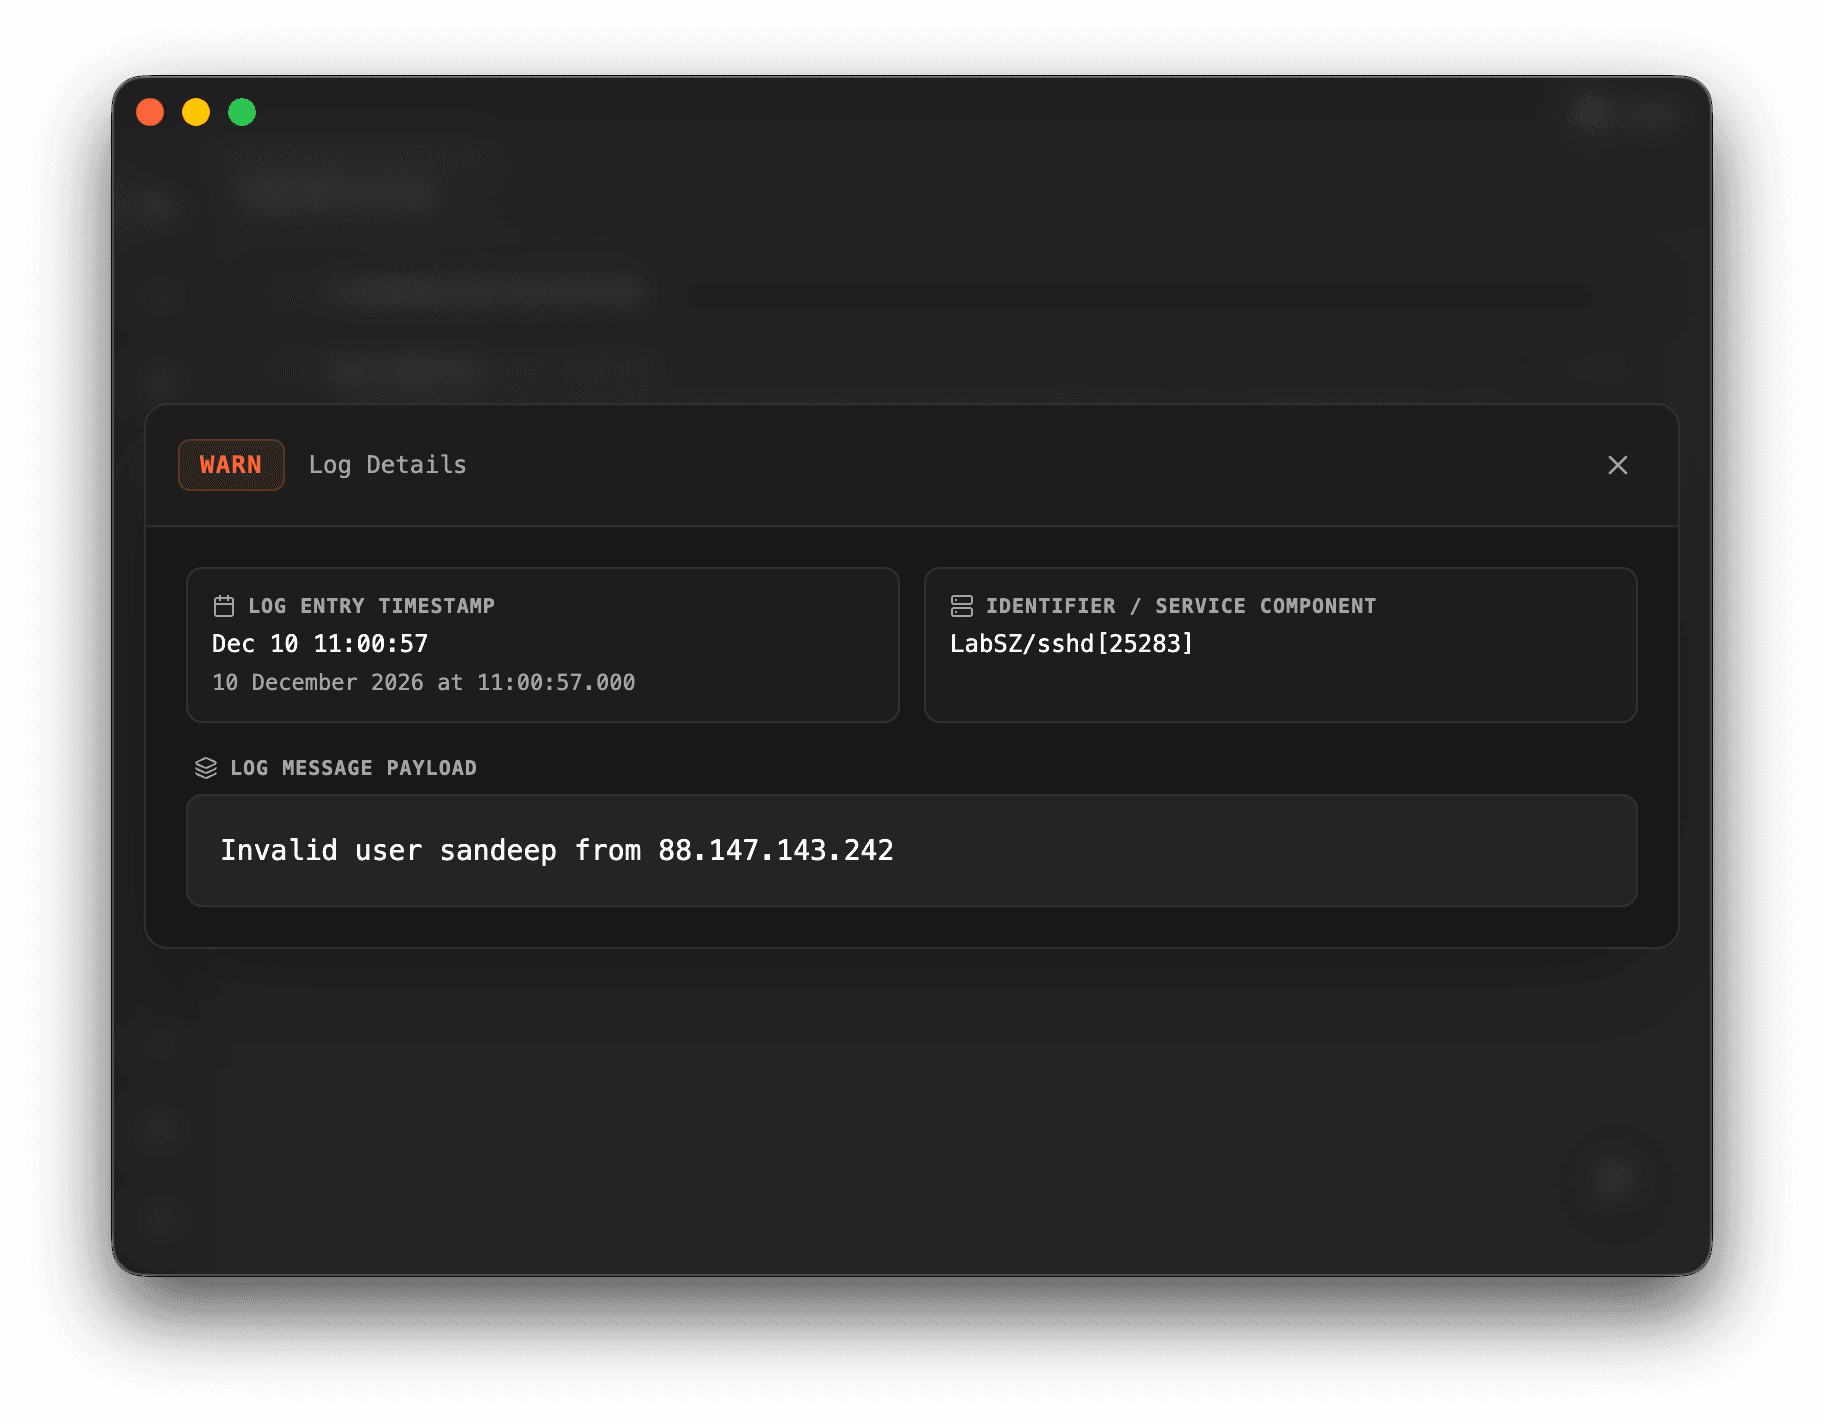
Opening an anomaly makes it easy to investigate what happened immediately before and after the detected event.
Understanding anomaly types#
Logier currently detects four categories of anomalies.
Frequency spikes#
A frequency spike occurs when a log level, such as Error or Warning, suddenly appears much more often than usual.
For example, an application that normally records one error every few minutes may suddenly generate dozens of errors within a short period.
These spikes often indicate cascading failures, outages, or repeated retries.
New message signatures#
Logier groups similar log messages together, ignoring values such as IDs, timestamps, IP addresses, and other changing data.
If a completely new message pattern appears after logging has already been underway, Logier flags it as a new signature.
For example:
Connection failed for user 123
Connection failed for user 456
Connection failed for user 789
are treated as the same message pattern.
This helps identify new failure modes without being distracted by messages that differ only in their values.
Silence gaps#
Some services normally produce logs at regular intervals.
If one of those services suddenly stops logging for much longer than expected, Logier reports a silence gap.
This can indicate:
- —A crashed service
- —Lost connectivity
- —Disabled logging
- —A stalled background process
The anomaly includes the duration of the gap and the time it began.
Outlier values#
Many applications log execution times or request durations.
Logier detects unusually large values within otherwise similar messages.
For example, if requests typically complete in 40 ms but one suddenly takes 1.8 s, Logier highlights that entry as an outlier.
This makes it easier to identify isolated performance issues without manually scanning every response time.
How anomaly detection works#
Logier analyzes the currently loaded log and compares entries against the surrounding data.
Rather than searching for fixed keywords, it looks for statistical patterns, including:
- —Sudden increases in log frequency
- —Previously unseen message patterns
- —Unexpected gaps in logging
- —Values that differ significantly from their typical range
This approach works across many different applications and log formats without requiring custom rules.
Because the analysis is heuristic-based, not every anomaly represents a real problem, and some legitimate issues may not be detected automatically.